
Upload and display simulation data
This example shows how to upload and display temperature simulation data on a PCB assembly and visualize the distribution of results across the design.
-
Before following these steps, you need to log in to the web application.
- Load a desired PCB design file on the Assembly loading page.
-
On the Information tab, in the Load
Simulation Data box, click
 to load or
drag and drop a file that contains temperature or displacement simulation
data.
-
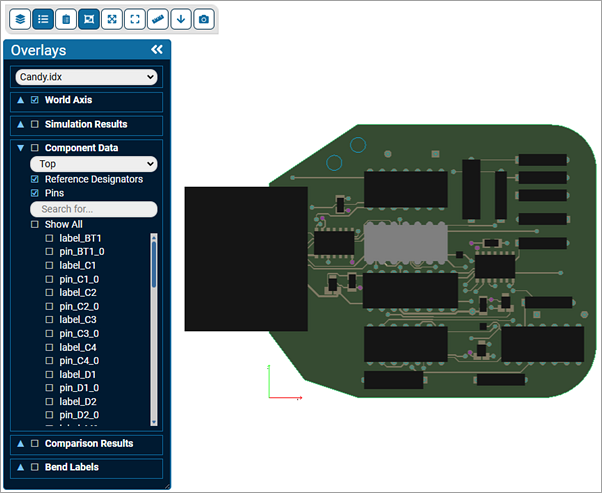
On the Viewer tab, click Overlays
Toolbox
 to open the
Overlays toolbox.
-
In the Overlays toolbox, select the
Simulation Result check box to display a heat map of
the PCB assembly based on the imported simulation values.
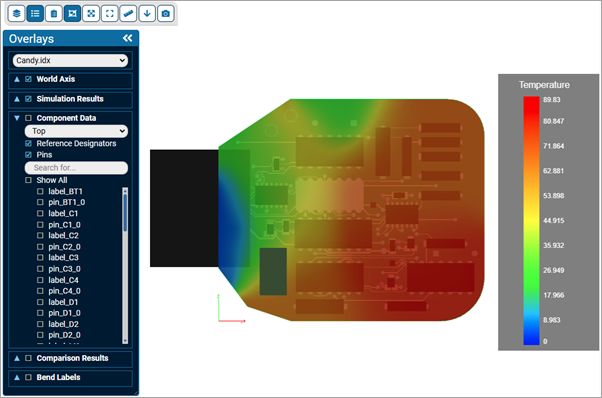
The software maps simulation values to colors that display as a heat map on the PCB design. Components not included in the simulation data are assigned a value of zero.