Using interactive tables
You can customize the data displayed in the interactive tables to better present and explore them.
- Filter and search data based on specific criteria.
- Group data.
- Sort data in ascending or descending order based on data in a particular column when you click on the column header.
Filtering and searching data
Filtering and searching data allow you to refine the dataset and quickly extract the relevant information. It is particularly useful when dealing with large datasets. You can access filters and the search box using quick access commands from the column header or through the Filters toolbox located on the right side of the table.
Grouping data
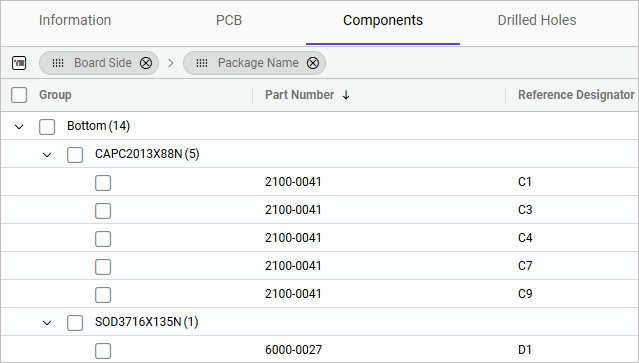
Grouping data allows you to organize and structure the information in a logical way. You can group related data together based on specific criteria, such PCB entity type and size, part number, or other PCB entity attributes. This makes it easier to navigate and understand the data, especially when dealing with large datasets. You can expand or collapse groups to reveal or hide detailed information, depending on your specific interests or goals. It helps visualize large amounts of data into a concise and structured format. You can group the data using the grouping row or the Columns toolbox.

Customizing table display
Using the quick access commands and the Columns and Filters toolboxes to modify the table display and columns allows you to adjust column widths, reorder columns, hide or show columns, lock specific columns and more.
To access the quick access commands, hover over a
column heading and click the column options ![]() command.
command.

- Order
- Visibility
- Pinning
- Width
- Grouping
| Command | Description |
|---|---|
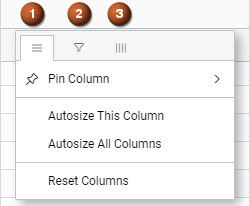
| 1. Column options | Displays a list of commands that let you reformat the columns to
help you better visualize the table data.
|
| 2. Column filter | Displays a list of filters that lets you filter data in the table to refine and extract specific information from a dataset. You can also clear and select the data that filters the rows from the filter list. For option descriptions, see Filters toolbox. |
| 3. PCB entity attribute list | Lists the PCB entity attribute columns that you can show or hide in the table display. |
